

Manager / owner
Analytics & decisions
A full picture of the business: revenue, margin, KPIs, and channel profitability in one dashboard.
14 days free, no credit card required.
 ZYNQ
ZYNQAs an owner or manager, you need one trustworthy answer to the question “how much am I actually making?”. ZYNQ pulls data from every channel - Allegro, Amazon, Erli, Empik, and your own store - and presents it on a single KPI dashboard. You see revenue, margin, order count and value, and trends in real time, without waiting for month-end. Instead of stitching numbers together across ten spreadsheets, you get an up-to-date picture of the business at a glance.
The analytics go deeper than top-line revenue: you break profitability down by channel, product, and customer, so you know what truly pays off versus what merely drives traffic. Configurable exports and reports (XLSX, CSV, PDF) can be sent to email or FTP, and period-over-period comparisons show whether your decisions are working. It's a tool for making data-driven calls instead of relying on gut feel - and for catching problems early, before they grow.
The challenge
Sales data scattered across Allegro, Amazon, and spreadsheets - hard to tell what actually makes money.
How ZYNQ helps
- KPI dashboard: revenue, margin, order count, and trends in real time
- Profitability per channel, product, and customer - see what pays off
- Configurable exports and reports (XLSX/CSV/PDF) to email or FTP
- Period comparisons without stitching spreadsheets by hand
Related features
See ZYNQ in your company
14 days free, no credit card required.
ZYNQ clients
ZYNQ in everyday e‑commerce operations
See how companies of different sizes use one system for sales, inventory, logistics and profitability analysis.
 ZYNQ
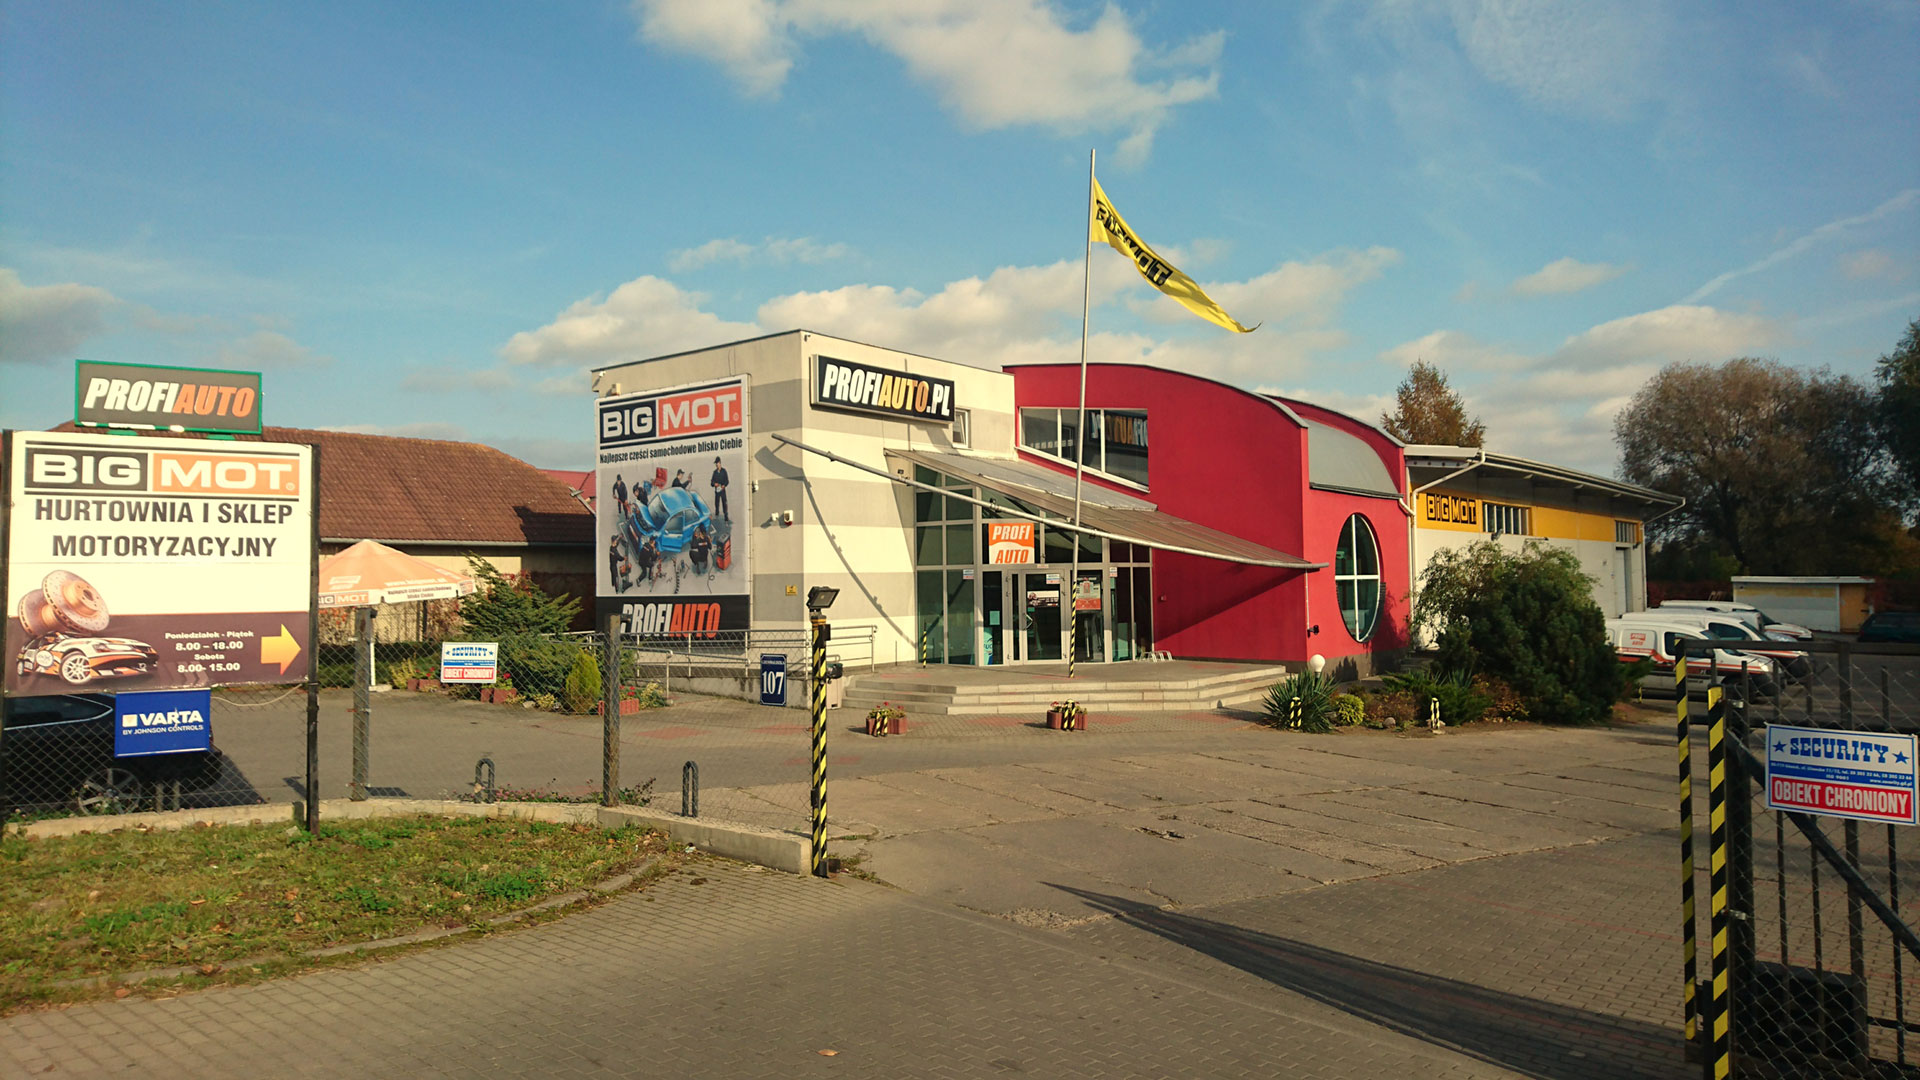
ZYNQBIG-MOT
Complete online sales operations
BIG-MOT uses ZYNQ for its online store, B2B catalogue and Polish and international marketplaces. One process connects warehouses, dropshipping, ERP, shipping and customer service.
View case study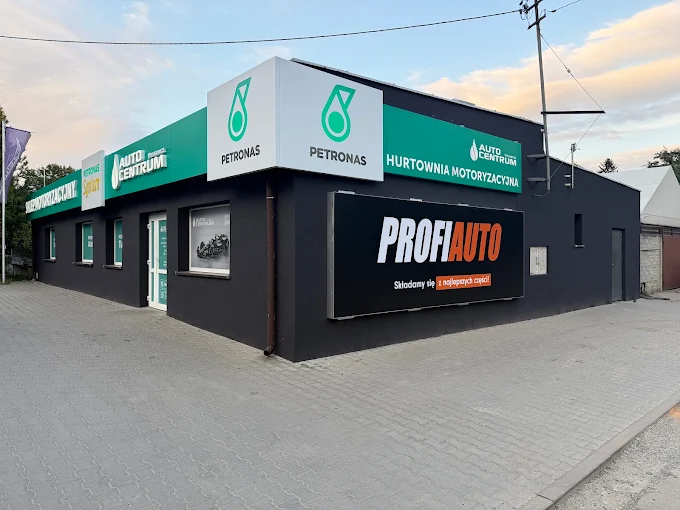 ZYNQ
ZYNQAuto Centrum
23% increase in sales margin
Auto Centrum combined multi-branch sales, warehouses and cost analysis in one system. Full order profitability helped increase the sales margin by 23%.
View case study ZYNQ
ZYNQAkces Dekoracje
E‑commerce distribution operations
Akces uses ZYNQ for B2B relationships, warehouse operations and domestic and international dropshipping. The system supports fast fulfillment, monitoring and partner invoicing.
View case study