

Decisions based on data - not hunches
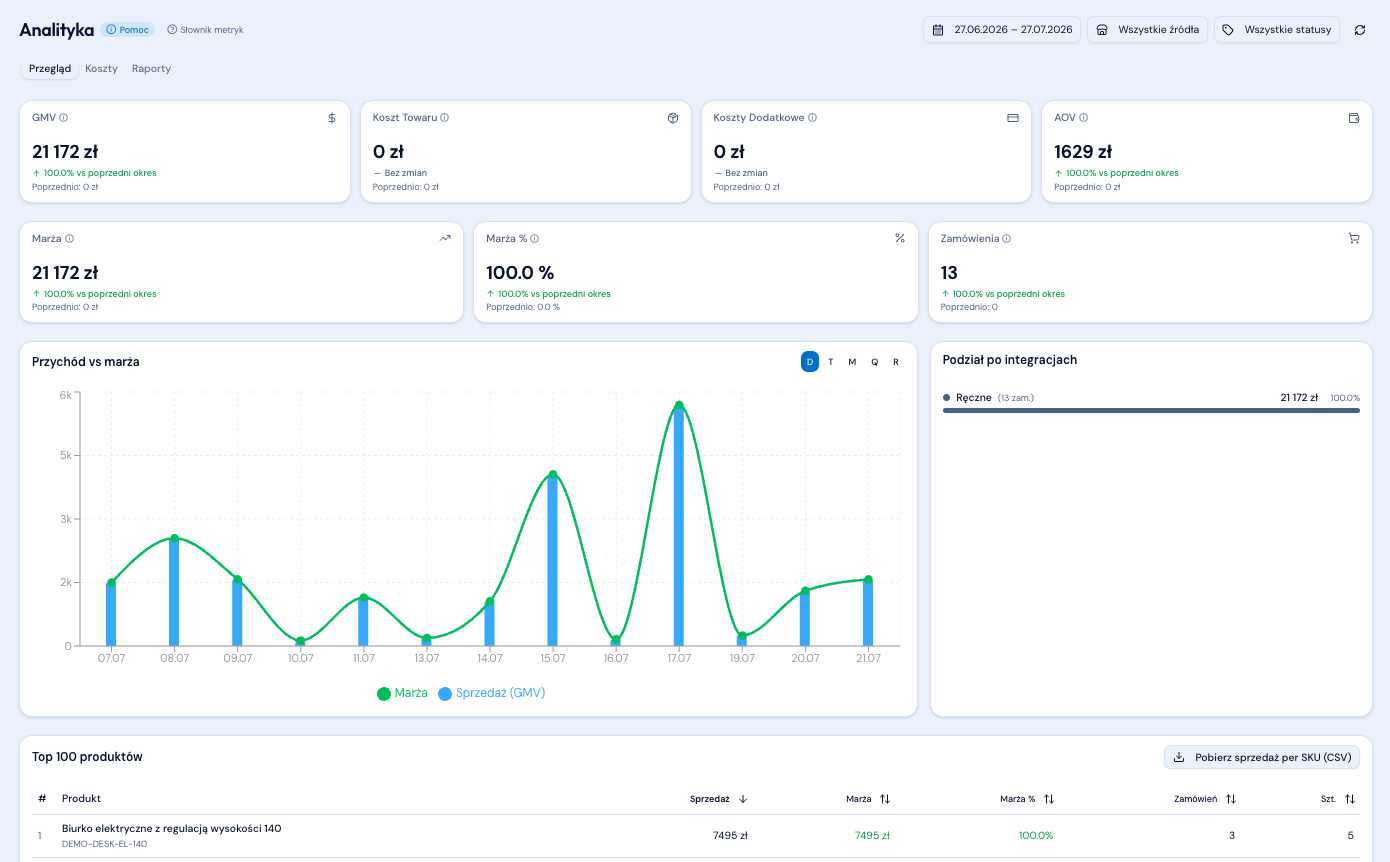
A complete picture of your business: GMV, margin, order count, sales broken down by integration and status. Compare periods, spot the channels driving the most revenue and the ones costing more than they return.
14 days free, no credit card required.
Key capabilities
Four key metrics
GMV, net sales, margin (value), margin (%) - each with a comparison to the previous period and a trend direction.
Breakdown by integration
See how much comes from Allegro, Amazon, Erli - with percentage share and order count per channel.
Revenue vs margin chart
Daily, weekly, monthly, quarterly, yearly. A single chart shows both the scale and the quality of your sales at once.
Filters by status and source
Analyze only completed orders, or only cancelled ones. A single integration, or all of them at once.
What else?
Excel export
Every metric and every chart is clickable - pull detailed data into XLSX and run deeper analysis in your spreadsheet.
Period comparison
Automatic calculation of the change vs the previous comparable period (prior week, month, year). In both percentage and absolute terms.
Real margin
Margin accounts for product purchase costs from PZ documents plus marketplace commission (Allegro). Real profit - not turnover masquerading as margin.
Saved reports
Save your frequently used filter and period configurations as a report - return to them with a single click.
Related features
ZYNQ clients
ZYNQ in everyday e‑commerce operations
See how companies of different sizes use one system for sales, inventory, logistics and profitability analysis.
 ZYNQ
ZYNQBIG-MOT
Complete online sales operations
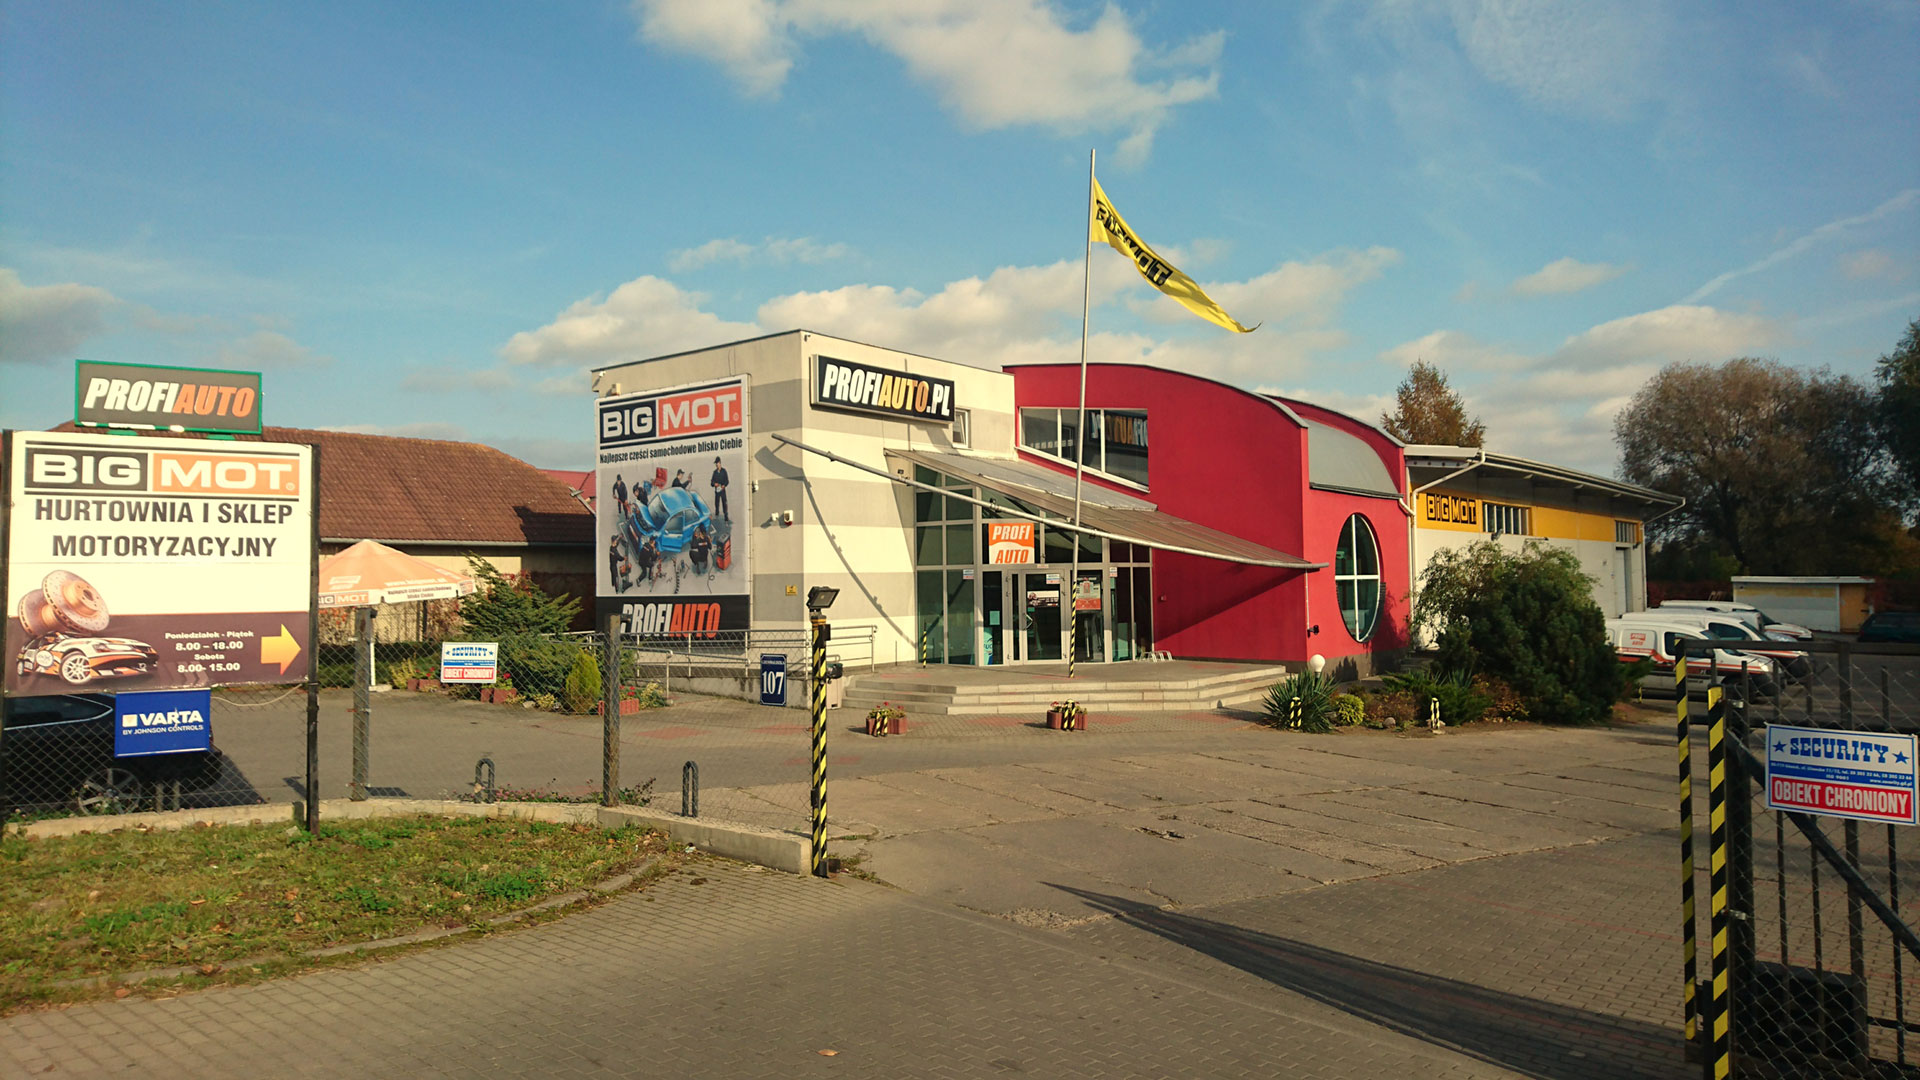
BIG-MOT uses ZYNQ for its online store, B2B catalogue and Polish and international marketplaces. One process connects warehouses, dropshipping, ERP, shipping and customer service.
View case study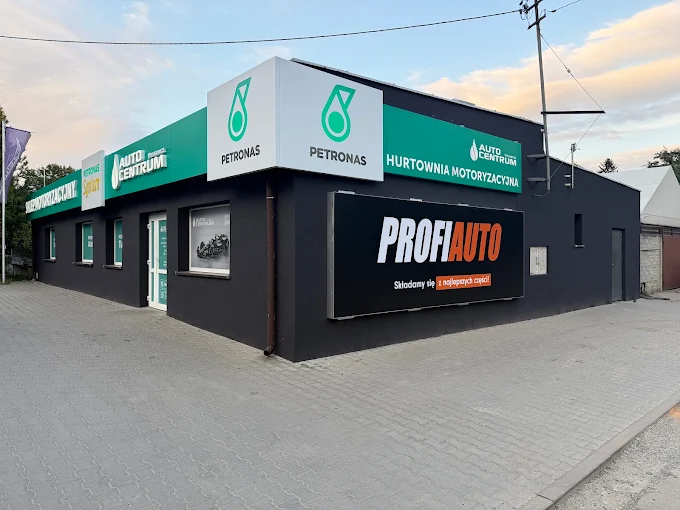 ZYNQ
ZYNQAuto Centrum
23% increase in sales margin
Auto Centrum combined multi-branch sales, warehouses and cost analysis in one system. Full order profitability helped increase the sales margin by 23%.
View case study ZYNQ
ZYNQAkces Dekoracje
E‑commerce distribution operations
Akces uses ZYNQ for B2B relationships, warehouse operations and domestic and international dropshipping. The system supports fast fulfillment, monitoring and partner invoicing.
View case study